
Low- and high-speed tests show that pump and motor performance can vary widely, depending on the speed and pressure. That’s critically important in electro-hydraulic actuators and electric-motor drives.
Contributed by Peter Achten and Robin Mommers, Innas BV, Breda, The Netherlands
Hydraulic component manufacturers generally publish pump and motor data that reflect optimal performance under ideal operating conditions. But experienced design engineers know that it is extremely difficult to obtain efficiency or performance data for less-than-perfect, real-world conditions. It even gets harder when looking at new concepts, such as electrohydraulic actuators, which run at very low as well as high speeds. There are almost no data for these applications.
To address this information void, Innas recently tested and benchmarked the performance of a number of different pumps and motors running over a range of pressures and flows. We specifically targeted the types of pumps being considered for electrohydraulic actuators designed for implement systems. Moog, for instance, is advocating their radial-piston pump, whereas Rexroth is focusing on axial-piston pumps. Others are looking at gear pumps, both internal and external.
Because an EHA is constantly moving back and forth, and a lot of the operation is at low speeds or near standstill, we developed a test bench that can measure at high as well as very low operating speeds. Furthermore, we wanted to know the extent of internal leakage for each unit, since significant leakage will result in a large dead-band. And we wanted to learn the upper speed limits, as electric motor developers prefer speeds of 5,000 rpm or higher, if possible.
Our published report shows that current pumps and motors are not made for electrohydraulic actuators. They are built for more or less constant-speed operation, driven by a diesel engine or an electric motor, generally running at 1,500 to 1,800 rpm.
Granted, many of the units tested are specified to not operate below a certain minimum speed simply because of significant wear or excessive internal leakage. Nonetheless, these limitations severely hinder their application in EHAs. Both dead-band and severe friction will inhibit the precise operation of hydraulic cylinders, especially because controllability will become much more important in the future. For this reason, we have tested these machines over a wide range of operating conditions.
Results indicate that there is a dire need for the development of new concepts. The Innas floating-cup principle represents one such advancement. Its mirrored design with 24 pistons, very short strokes, a small displacement angle and hydrostatic lubrication provides extremely high efficiency even at start-up. And it can precisely control significant loads at speeds of just 2 to 3 rpm with virtually no wear. But we strongly believe that more breakthroughs are required. We plan to continue to measure the performance of other pumps and motors, and publish updated results on our web site.
Testing background
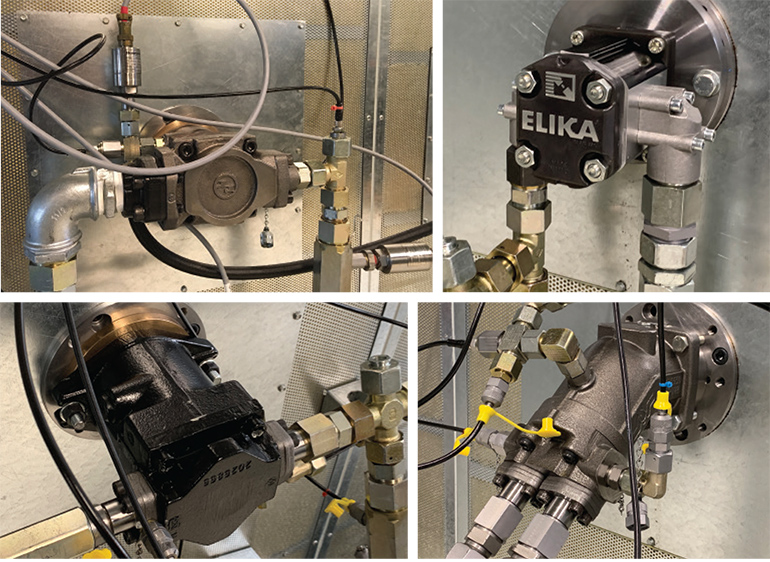
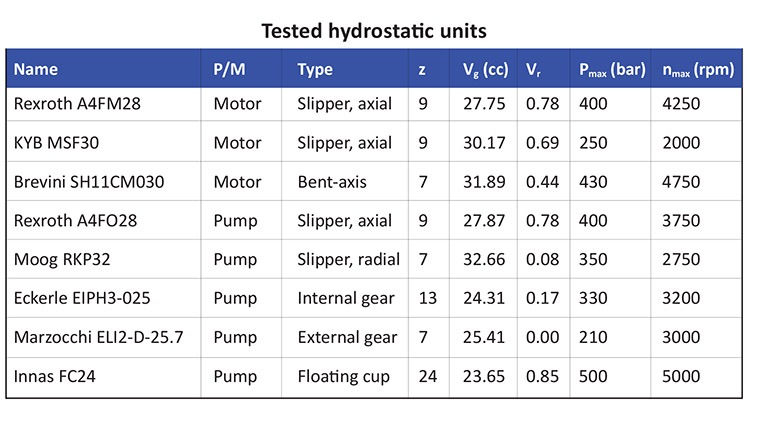
The report contains results for performance measurements on eight different hydrostatic devices: three piston pumps, three piston motors, and two gear pumps. Important specifications are shown in the accompanying table. The piston-type units have from 7 to 24 pistons. From a physical point of view, the number of pistons is similar to the number of teeth in a gear pump. Derived geometric displacement volumes range from 23.7 to 32.7 cc/rev.
Each pump and motor was measured using a unique test bench, developed by Innas engineers, which can operate a hydrostatic device at speeds ranging from 5,000 rpm to less than 0.01 rpm. More details are available in the sidebar, “Novel test rig is incredibly versatile.”
During tests, sensors in the mechanical components and hydraulic circuit measured:
- Torque on the main shaft, T
- Speed of the main shaft, ω
- Pressure on the low- and high-pressure side, and in the housing
- Oil temperature at the low- and high-pressure side, and leakage
- Main flow rate at the high-pressure side, Q2
- Leakage flow rate, Q3
Efficiency and losses
To analyze the different devices, we looked at the measurement results. The three most important quantities used to describe the performance of the test subjects are the overall efficiency ηt, torque loss Tloss, and leakage Q3. Efficiency and torque loss are derived from the measured data, while leakage is measured directly.
It is important to note that several definitions used here differ from the current standard for measuring the performance of hydrostatic machines as described in ISO 4409:2019 and ISO 4391 — in particular the compressibility correction factors a1 and a2. A large group of experts from around the world agree with the need for these new efficiency definitions.
Overall efficiency. To determine the efficiency of a hydrostatic machine, we first calculated the mechanical power Pm and hydraulic power Ph:
Pm = Tω
Ph = p2Q2a2 − p1Q1
T and ω are the measured torque and shaft speed, p1 and Q1 are the pressure and flow rate of oil through line i (1 = low pressure line, 2 = high pressure line), and a2 is a correction factor to account for the compressibility of oil at high pressures. As derived, a2 = 1 + (p2/2Ks) where Ks is the oil isentropic bulk modulus.
In a pump, mechanical power converts into hydraulic power, while a motor works the other way around. Overall efficiency ηt is the ratio at which power is converted; for a pump:
ηtP = Ph/Pm = (p2Q2a2 − p1Q1)/Tω
and for a motor:
ηtM = Pm/Ph = Tω/(p2Q2a2 − p1Q1).
Torque loss. Torque losses during operation are calculated by comparing measured torque T to theoretical torque Tth:
TPloss = T − Tth
TMloss = Tth – T.
The difference in sign is similar to the difference in sign for the efficiencies: torque drives a pump to generate pressure and flow, while pressure and flow drives a motor to generate torque. The theoretical torque will thus be lower than the measured torque for pumps, to overcome friction and pressure ripples, and the opposite for motors. The theoretical torque can be calculated using:
Tth = ((p2 − p1)Vg/2π)a1
with Vg the derived geometric displacement volume, and a1 a correction factor to account for the compressibility of oil at high operating pressures.
a1 = 1 − (0.5 + Vmin/∆V)(∆p/Ks)
with Vmin the dead volume per cylinder, and ∆V the geometric displacement volume per piston. To compare the torque loss of pumps and motors of different sizes, torque loss can be normalized. The normalized torque loss TNloss is defined as 1 − Tth/T for a pump and 1 – T/Tth for a motor.
Oil model. Correction factors a1 and a2 used an isentropic bulk modulus Ks = 1.76 × 10⁹ Pa, which was suitable for our measurements using a Shell Tellus46 oil at roughly 50°C and pressures ranging to 400 bar. Detailed oil modeling concluded that using a single constant bulk modulus sufficed in deriving the performance of the machines tested. More details can be found in the report, “Performance of Hydrostatic Machines,” available at innas.com.
Measurement results
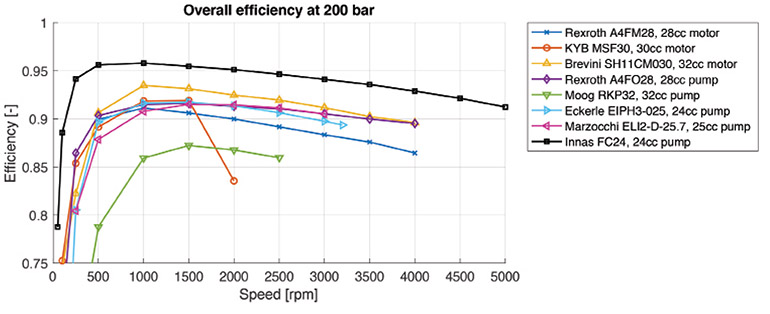
Overall efficiencies of the different pumps and motors were determined based on the above equations. The results for various shaft speeds at an operating pressure of 200 bar are shown in the Overall Efficiency graph. All of the tested subjects followed the same trend: Efficiency is low at low operating speeds; increases rapidly until maximum efficiency is reached somewhere between 1,000 and 2,000 rpm; and as shaft speed increases further, efficiency decreases, but at a much lower rate.
At this pressure, the highest peak efficiency of almost 0.96 was realized by the Innas pump at 1,000 rpm, while the Moog pump had the lowest peak efficiency of 0.87 at 1,500 rpm. One outlier is the KYB motor’s measurement point at 2,000 rpm. Here, efficiency decreases much faster than was expected. However, the unit was running near its maximum rated operating speed, which causes additional torque loss and leakage.
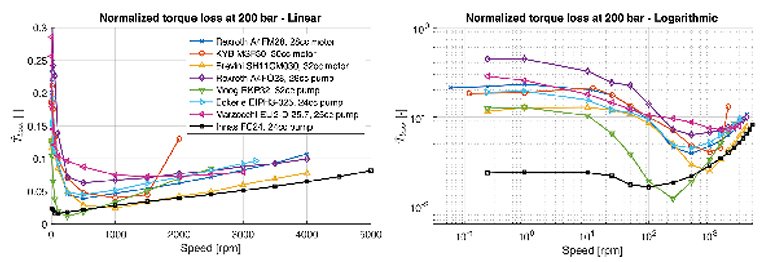
We then used the torque-loss equations to calculate the difference between the theoretical and measured torque for each device. To properly compare machines of different sizes, these losses have been normalized. The Normalized Torque Loss graphs show both linear and logarithmic scales at 200 bar. The linear plot shows losses at normal operating conditions, while the logarithmic plot provides some insight into the losses during low speed operation — for example, startup conditions.
Overall, the torque loss shows a similar trend for motors and pumps. Below 1 rpm (see logarithmic plot) losses appear to be constant. At some point, the torque loss quickly decreases for increasing shaft speeds, until reaching a minimum. From this speed onwards, the torque loss increases again, but at a slower rate. This trend is very much in accordance with the Stribeck curve, and the three sections describe the transition from coulomb friction (boundary lubrication), to mixed friction, and viscous friction (hydrodynamic lubrication), respectively.
In the linear plot, we see that at this pressure level the three motors have similar torque losses at normal operating speeds. Furthermore, the logarithmic plot shows that the Brevini motor outperforms the other two motors in the low speed range, where it has less torque loss than the KYB and Rexroth motors.
The five pumps show larger differences with respect to each other. Overall, the Innas pump has the lowest torque loss at this pressure, especially in the low speed range. This can be explained by the fact that this is a floating-cup type pump, which has almost no contact between the piston and bore, and thus very little coulomb friction. In the viscous-friction section, torque losses in the Rexroth, Eckerle, and Innas pumps increase at roughly the same rate. Torque loss for the Moog pump increases at a faster rate, while the torque loss of the Marzocchi seems relatively constant at higher operating speeds.
The graphs show that torque loss is more or less constant at operating speeds below 1 rpm, due to coulomb friction. During the low-speed measurements, each unit can be tested during both pump and motor operation. (Because the Eckerle pump is an internal gear pump, it cannot be tested as a motor.) For most piston machines the torque loss due to coulomb friction is larger when it is driven as a pump. The exception being the Brevini, which has more or less the same torque loss for both directions.
This can be explained by the direction in which the piston moves during the high pressure stroke. When operated as a pump, the piston pushes the barrel to the portplate during the high pressure stroke, increasing the friction between those two surfaces and, therefore, the torque loss. When operated as a motor, the piston pulls the barrel away from the portplate, decreasing friction.
The highest torque loss was found on the Rexroth pump, which loses up to 60% of torque at these operating speeds. It is worth noting that the two Rexroth units are, apart from silencing grooves in the portplates, the same product. This was confirmed by comparing the torque losses when they were driven in the same direction.
The normalized torque loss of the Innas pump during low speed motor operation becomes less than zero. In other words, more torque was delivered to the shaft than the theoretical maximum. At these low speeds, leakage will be larger than the amount of displaced oil. In this case, an additional pump provides the right pressure level. Unfortunately, the calculations no longer apply in this situation, making it impossible to derive the overall efficiency. This approach emulates the behavior of units as part of a larger hydraulic network, which is often the case. It is currently hypothesized that the pressure delivered by this supply pump affects torque on the test specimen’s shaft as well. Further research will be needed to determine why this is the case, and what it means for further analyses.
Results also show that at these low speeds there is a significant variation in torque loss at different angular shaft positions. In the case of pumps, this normalized torque is larger than 1, meaning that a certain amount of additional torque is needed to overcome the friction. Some of the tested specimens needed as much as 80% extra torque to operate at this speed. In the case of motors, the normalized torque is less than 1, meaning that less torque is provided by the supplied oil. One unit showed a torque loss as much as 30%.
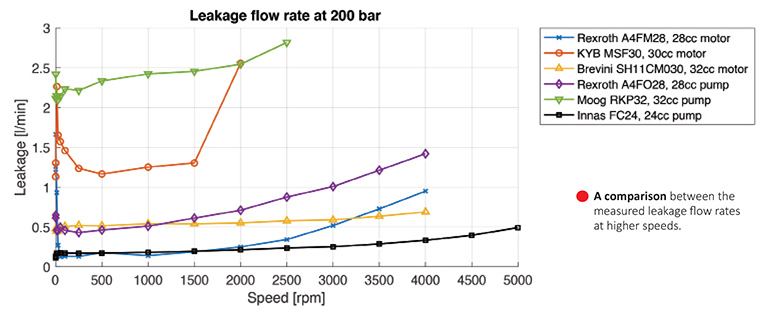
Leakage flow rate
The leakage flow rate from the rotary group to the pump or motor housing is measured directly in the test bench. (Note that the gear pumps do not have an external leakage port, so leakage cannot be measured.) Internal leakage affects the total output flow rate and, thus, the efficiency calculations. Measured leakage for each device at 200 bar showed that for most, leakage increases slightly for increasing shaft speeds. This makes sense, because increasing the shaft speed will linearly increase the amount of displaced oil. However, the relatively constant leakage flow rates at low operating speeds suggest that it does not only depend on shaft speed. A constant leak flow generally means that the gap through which oil leaks does not change much, indicating that this is probably caused by the precision with which the parts have been made and how accurately they fit together.
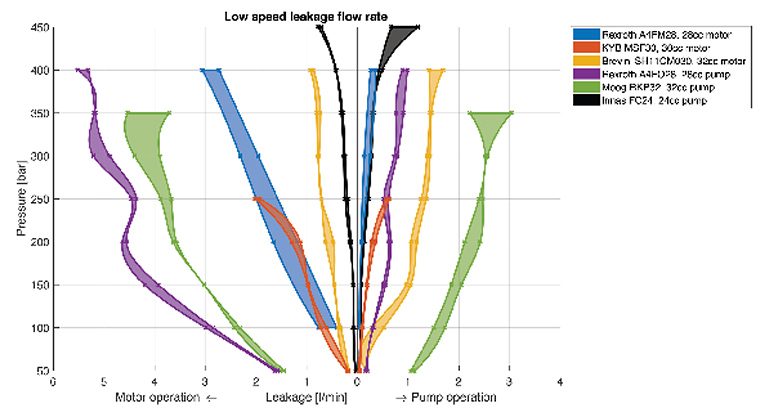
Similar to the low speed torque losses, the Low Speed Leakage Flow Rate graph shows average leakage conditions for measurements at speeds less than 1 rpm. Tests showed a sizeable variation in leakage between the different measurements. Main factors for these larger ranges seem to be the oil temperature (which is difficult to control during low speed measurements) and the case pressure (mainly for the Moog pump).
Even though there is a significant spread in the flow rate measurements at different low speeds, leakage is generally higher during motor operation for most machines. When operated as a pump, the piston pushes the barrel to the portplate during the high pressure stroke, decreasing the size of this leakage path. When operated as a motor, the piston pulls the barrel away from the portplate, which allows for more leakage. Exceptions are the Innas pump, which has more or less equal leakage in both directions; and the Brevini motor, which has more leakage when driven as a pump than as a motor.
Interestingly, while the two Rexroth units showed similar torque losses, there is a large difference between their leakage flow rates — most likely due to the difference in portplates. Because these measurements take a long time, and only little oil flows through the unit, housing temperature decreases over time. This has a large effect on the viscosity of the leakage oil, causing oil to flow slower at lower temperatures. When measurements are conducted in succession, the housing and oil need to be heated between each test run.
Innas
innas.com
Novel test rig is incredibly versatile
The Innas test bench can operate hydrostatic pumps and motors over an extremely wide speed range — from 5,000 rpm to less than 0.01 rpm — thanks to two different types of actuators.
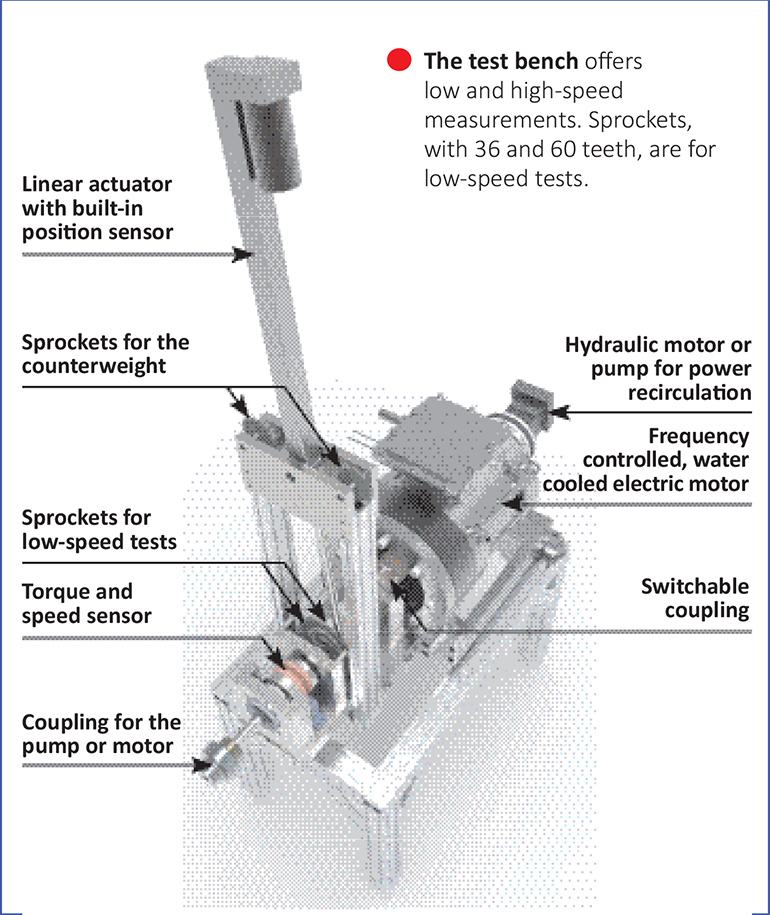 The pump or motor tested is coupled to the main shaft, followed by two different-sized sprockets. An electric linear actuator can connect with either sprocket to drive the shaft at speeds from around 1 rpm to less than 0.01 rpm. A coupling next to the sprockets lets technicians switch to operation by a large electric motor. This electric motor can rotate the test subject at any speed between 10 and 5,000 rpm. A second hydrostatic unit can be attached at the back end to recirculate the generated power. It operates as a pump when the test involves a motor, and vice versa.
Before each measurement, the test subject is driven at a moderate speed and pressure, to allow it and the oil to warm up. When both are at a steady temperature (around 50°C), test parameters are measured during operation at a number of predetermined speeds and pressure levels. This procedure is in accordance with ISO4409:2019 and is used to determine the geometrical displacement.
After high-speed performance tests, low-speed tests are performed by shifting the coupling and connecting the linear actuator. The integrated set-up ensures that the test object, all sensors and hydraulic lines remain on the test bench. Additionally, the oil and pump or motor remain at warm operating temperatures. During low-speed measurements, the linear actuator first makes a downward stroke followed by an upward stroke. Thus, the unit is tested both as a motor and as a pump.
Filed Under: Mobile Hydraulic Tips, Pumps & Motors